Institutional investment inflows in Indian realty touch USD 1.1 bn during Q3 2024 (July -Sept), up 45%: Colliers
Mumbai, 02 October 2024: Sustained confidence in the Indian economy continued to drive institutional investments into the real estate sector, reaching USD 4.7 billion during the first three quarters of 2024, almost at par with the corresponding period in 2023. Following significant inflows in the first two quarters, Q3 2024 also registered a healthy investment inflow of about USD 1.1 billion, reflecting a 45% YoY growth. The office segment accounted for 54% of the total investments during the quarter, followed by residential, with a 33% share. Residential inflows during Q3 2024 were particularly driven by domestic capital. Overall domestic investments remained robust at USD 0.5 billion, driving 44% of the total inflows during the quarter.
“Institutional flows in Indian realty remain consistent, indicating sustained investor confidence. The investors are well diversified between global and domestic capital. While office assets remain a key focus, industrial & warehousing and residential segments are gaining significant momentum. The newer emerging themes like fractional ownership in office & warehousing, residential platforms with developers, flexible credit, and hospitality are driving opportunities for investors. Of the total USD 4.7 billion institutional inflows during the first nine months of 2024 (Jan-Sept), over 60% were directed towards industrial & warehousing and residential assets. With continued momentum, 2024 is expected to end on a higher note, likely surpassing 2023 volumes,” said Piyush Gupta, Managing Director, Capital Markets & Investment Services at Colliers India.
In addition to continued traction in domestic capital, foreign investors also maintained a sizeable and healthy appetite for Indian real estate. At USD 0.6 billion inflows in Q3 2024, foreign investments have more than doubled compared to the investments witnessed in Q3 2023.
Investment inflows (USD million) Q3 2024–
| Asset Class | Q3 2023 | Q2 2024 | Q3 2024 | Q3 2024 vs Q3 2023 (% YoY Change) | Q3 2024 vs Q2 2024 (% QoQ change) |
| Office | 79.1 | 334.4 | 616.3 | 679% | 84% |
| Residential | 274.6 | 543.5 | 384.8 | 40% | -29% |
| Alternate assets* | 72.2 | – | – | -100% | – |
| Industrial & Warehousing | 340.3 | 1,533.1 | 95.2 | -72% | -94% |
| Mixed use | 27.2 | 122.3 | 52.4 | 93% | -57% |
| Retail** | – | – | – | – | – |
| Total | 793.4 | 2,533.3 | 1,148.7 | 45% | -55% |
*Note: Alternate assets include data centers, life sciences, senior housing, holiday homes, student housing, schools etc. (Investment inflows in alternate assets were limited in both Q2 and Q3 2024)
**Investment inflows in Retail were limited in Q3 2023, Q2 2024 & Q3 2024
Source: Colliers
Investment inflows (USD million) YTD 2024 –
| Asset Class | YTD (Jan-Sep) 2023 | YTD (Jan-Sep) 2024 | YTD 2024 vs YTD 2023 (% YoY Change) |
| Office | 2,886.9 | 1,513.6 | -48% |
| Residential | 707.9 | 1,030.9 | 46% |
| Alternate assets* | 230.4 | 21.0 | -91% |
| Industrial & Warehousing | 690.6 | 1,806.0 | 162% |
| Mixed use | 42.3 | 305.6 | 622% |
| Retail** | – | – | – |
| Total | 4,558.1 | 4,677.1 | 3% |
*Note: Alternate assets include data centers, life sciences, senior housing, holiday homes, student housing, schools etc.
**Investment inflows in Retail were in YTD 2023 and YTD 2024
Source: Colliers
Quarterly investments in the Office segment surged by 6.8X times over Q3 2023
After witnessing subdued activity in the previous quarter, investments in the office segment doubled on a QoQ basis, at USD 0.6 billion inflows. At the same time, investments also rose by 6.8X times as compared to the same period last year. Foreign investments accounted for 88% of the total inflows into the segment during Q3 2024. Going forward, robust demand and supply momentum in Grade A office spaces across the top markets will keep the investor confidence buoyant.
Apart from office assets, residential assets too witnessed notable inflows during the quarter at USD 0.4 billion, witnessing a substantial surge of 40% on a YoY basis.
“Private equity investments in the residential segment are on the rise, fuelled by home-ownership trends and growing interest from domestic as well as foreign institutional investors. In the first nine months of 2024, investments in the segment crossed USD 1 billion, marking a significant 46% year-on-year increase. Q3 2024 alone saw USD 0.4 billion in residential investments, accounting for one-third of the total investments in the quarter. Most of these investments were directed towards developmental assets, as institutional investors continue to partner with reputed developers in marquee residential projects. With a conducive domestic environment, ongoing festive season and a much-anticipated reduction in interest rates, investor confidence in India’s residential real estate market is poised to remain intact,” said Vimal Nadar, Senior Director and Head of Research, Colliers India.
Chennai & Mumbai together drove about 57% of the quarterly inflows
Chennai and Mumbai together accounted for about 57% of the total inflows during Q3 2024 backed by key acquisitions in office segment. Almost 70% of the inflows in Chennai during the quarter were driven by foreign investments. Mumbai and Delhi NCR cumulatively witnessed about 44% of the total quarterly investments in the residential segment. Furthermore, multi-city investments corresponded to 30% of the overall inflows during Q3 2024 and were predominantly directed towards office and residential asset classes.
City-wise investment inflows in Q3 2024 –
| City | Q3 2023 | Q3 2024 | Investment share in Q3 2024 (%) | Q3 2024 vs Q3 2023 (%) | YTD (Jan-Sep) 2023 | YTD (Jan-Sep) 2024 | Investment share YTD 2024 (%) | YTD 2024 vs YTD 2023 (%) |
| Bengaluru | 45.1 | 54.0 | 5% | 20% | 241.8 | 486.0 | 10% | 101% |
| Chennai | 47.0 | 380.1 | 33% | 710% | 132.3 | 534.2 | 11% | 304% |
| Delhi NCR | 24.3 | 79.6 | 7% | 228% | 492.0 | 417.5 | 9% | -15% |
| Hyderabad* | – | – | – | – | 127.3 | 300.9 | 6% | 136% |
| Mumbai | 196.6 | 277.6 | 24% | 41% | 585.8 | 406.7 | 9% | -31% |
| Pune | – | 10.8 | 1% | >100% | – | 269.0 | 6% | >100% |
| Others/ Multi-City | 480.4 | 346.6 | 30% | -28% | 2,978.9 | 2,262.8 | 49% | -24% |
| Total | 793.4 | 1,148.7 | 100% | 45% | 4,558.1 | 4,677.1 | 100% | 3% |
Source: Colliers
Note: * Investment inflows in Hyderabad were limited in both quarters
Storyblok partners with Deloitte Digital
Deloitte Digital uses Storyblok to complete tailored experience delivery tasks in 2 hours instead of 2 days
New York, NY – 10am EST – September 30, 2024 – Storyblok, the modern content management system (CMS) for all teams, has added global creative consultancy Deloitte Digital as a Certified Partner. Storyblok’s Certified Partners are a selected group of agencies that are best-equipped to help brands implement the CMS to accomplish digital transformation projects.
Deloitte Digital started its journey with Storyblok while building a Sustainability & Climate website for its parent company, Deloitte. The agency wanted to use an efficient CMS that fits the mission and message of the website.
Thanks to the flexibility of Storyblok, Deloitte Digital was able to meet its efficiency goal by using Storyblok for content creation, editing, and then exporting the published content to a monolithic CMS used for hosting the website.
Once the developers and content team experienced the productivity benefits of Storyblok and its easy-to-use Visual Editor through this project, they started using it to quickly develop website concepts for new customers using composable components.
Christian Hartkemeyer, Senior Manager at Deloitte Digital, said: “It only takes 2 hours to complete the delivery of tailored experiences in Storyblok that used to take 2 days in other CMSs. The more we use Storyblok, the more we want to use it for other internal and customer projects. Being a Storyblok Certified Partner means that our customers can trust us to deliver similar results for them.”
Barry D’Arcy, VP of Partners at Storyblok, said: “Deloitte Digital’s expertise in digital innovation underscores Storyblok’s flexibility as a powerful CMS. From strategic digital initiatives to comprehensive transformations, their proven experience allows us to deliver exceptional content solutions globally. Together, we are empowering more brands to embrace modern content management and unlock the full potential of their digital experiences.”
 Blog
Blog
America’s Most Welcoming Holiday Cities Ranked
| City Name | Population | Number Of Hotels | Number of Hotels with 4* and above rating | Percentage of High-Rated Hotels | Average Hotel Price | Happiness Score | Recreation Score | Food & Entertainment Score | Traffic Index | Crime Index | Safety Index | Highest Temperature C | Lowest Temperature C | Composite Score |
| Gilbert, AZ | 247,542 | 139 | 69 | 49.64% | $191.88 | 62.99 | 152 | 144 | 115 | 14 | 86 | 26 | 15 | 99 |
| Fremont, CA | 232,206 | 185 | 113 | 61.08% | $168.54 | 74.16 | 145 | 176 | 113 | 42 | 58 | 22 | 11 | 90 |
| Irving, TX | 236,607 | 129 | 66 | 51.16% | $300.78 | 51.93 | 167 | 140 | 107 | 37 | 63 | 26 | 15 | 81 |
| Garland, TX | 236,897 | 121 | 49 | 40.50% | $127.05 | 50.87 | 134 | 154 | 106 | 36 | 64 | 26 | 15 | 79 |
| Chula Vista, CA | 277,096 | 49 | 20 | 40.82% | $75.19 | 61.75 | 159 | 179 | 170 | 56 | 44 | 22 | 15 | 78 |
| Chandler, AZ | 280,663 | 168 | 94 | 55.95% | $225.58 | 60.9 | 128 | 93 | 135 | 23 | 77 | 26 | 15 | 77 |
| Laredo, TX | 264,473 | 73 | 37 | 50.68% | $134.83 | 45.52 | 117 | 170 | 158 | 36 | 64 | 29 | 18 | 76 |
| Hialeah, FL | 237,069 | 145 | 82 | 56.55% | $197.06 | 52.91 | 107 | 165 | 151 | 45 | 55 | 29 | 22 | 75 |
| Irvine, CA | 330,521 | 120 | 71 | 59.17% | $222.99 | 68.22 | 57 | 131 | 73 | 26 | 74 | 24 | 12 | 74 |
| Riverside, CA | 319,504 | 153 | 72 | 47.06% | $570.44 | 56.69 | 124 | 141 | 99 | 40 | 60 | 26 | 12 | 73 |
2024 Hyundai Card DaVinci MOTEL – Day 1
Hyundai Card hosts the first day of the ‘2024 Hyundai Card DaVinci MOTEL’ event at its branded spaces in Seoul’s Itaewon district on September 27. This 3-day event brings unique K-culture experiences to local and international visitors. The event features cultural icons from the arts, academia, business, and technology sectors who will present various programs, including talk shows, live performances, exhibitions, and busking.
![[Photo 4] ‘2024 Hyundai Card DaVinci MOTEL’_Day 1](https://onlinemediacafe.com/wp-content/uploads/2024/09/Photo-4-‘2024-Hyundai-Card-DaVinci-MOTEL_Day-1.jpg)
This year, from September 27 through 29, the event will feature 39 curated sessions covering a range of topics, including history, science, law, and K-culture.

Popular Korean hip-hop artist, GIRIBOY, performs at Understage, one of Hyundai Card’s branded venues in Itaewon, on the first day of the 2024 Hyundai Card DaVinci MOTEL festival. A fully captivated audience enjoyed GIRIBOY’s passionate and energetic hip-hop performance. ‘2024 Hyundai Card DaVinci MOTEL,’ the only threeday cultural and intellectual festival in Korea, will be held until September 29 in Seoul’s Itaewon district.
The Importance of Compliance Management in Businesses to Mitigate Risk & Ensure Security
As regulatory requirements evolve, businesses face increasing pressure to comply with laws and industry standards. Continuous compliance Management can help organisations to prevent lawsuits and policy violations. Compliance management software has emerged as a vital tool to help organisations efficiently manages these challenges.

TeamLease Regtech CEO and Co-Founder Rishi Agrawal has simplified compliance management, ensuring businesses stay on top of regulations, avoid penalties, and increase operational efficiency.
Here are the ways to stay compliant and how it can help businesses streamline their processes:-
1. Streamlining Compliance Processes with Automation
Manual compliance processes are often complex, time-consuming, and prone to errors. Compliance management software, such as TeamLease Regtech, automates tasks like tracking regulatory updates, generating reports, and monitoring compliance status. This reduces the administrative burden on teams and ensures more consistent compliance practices.
2. Real-Time Monitoring and Alerts
Keeping up with the constant changes in regulations is one of the biggest challenges businesses face. Compliance software provides real-time monitoring of legal updates and automatically alerts businesses of relevant changes. TeamLease Regtech ensures organisations are immediately notified of any regulatory shifts, helping them stay compliant at all times.
3. Reducing Legal and Financial Risks
Failure to comply with regulations can result in hefty fines, lawsuits, and reputational damage. Compliance management software helps mitigate these risks by ensuring businesses follow all necessary legal guidelines. TeamLease Regtech offers tools that assess and track risk exposure, allowing companies to take proactive measures and reduce the likelihood of non-compliance.
4. Customizable for industry-specific needs
Different industries are subject to different regulatory frameworks. TeamLease Regtech allows organisations to customise their compliance management system to fit their specific needs, ensuring they meet industry-specific regulations such as GDPR, PCI-DSS, or HIPAA. This adaptability makes it easier for businesses to manage multiple layers of compliance.
5. Simplified Reporting and Audits
Regulatory audits require thorough documentation and preparation. Compliance management software automates the reporting process, making it easier for businesses to prepare for audits. TeamLease Regtech generates detailed reports and keeps a comprehensive audit trail, reducing the time and effort required to stay audit-ready.
6. Ensuring Data Protection and Privacy
In the age of data breaches and privacy concerns, staying compliant with data protection laws is critical. Compliance management software helps businesses safeguard customer and employee data by ensuring adherence to privacy regulations. TeamLease Regtech offers features that monitor data handling practices and ensure compliance with privacy laws, reducing the risk of data breaches.
Honeywell to Develop Artificial Intelligence-Enabled Agent Powered by Qualcomm
INDIA, September 24, 2024 – Honeywell (Nasdaq: HON) today announced that it is working to develop an artificial intelligence (AI)-enabled Multi-Modal Intelligent Agent for Honeywell mobile devices powered by Qualcomm Technologies, Inc. The agent will allow workers and customers in the distribution center and retail industries to interact naturally with their handheld devices through voice, pictures, and barcodes.

This AI-powered solution is built to function as a digital resource for the modern labor force and designed to enable today’s stretched workforce to quickly tap into answers and outcomes, helping result in time savings, greater accuracy, and interactive results. The design and development of the Multi-Modal Intelligent Agent also supports Honeywell’s alignment of its portfolio to three compelling megatrends, including automation.
Workers will be able to enter data into the technology and then receive practical answers to queries like, “Do we have the gluten-free variant of this product in stock?” or “Where can I find this particular item in the store?” Depending on the question, users will receive responses in the form of an image, video, spoken response, text answer, or a combination of several modalities. This functionality is designed to enable workers to more efficiently complete their work while simultaneously navigating other ongoing tasks, such as assisting customers in a retail setting or performing multi-step workflows in a distribution center. The solution will be available to users through a software development kit that can integrate with an organization’s existing applications and systems.
“Utilizing our strengths in on-device generative AI, high-performance and low power computing, this collaboration with Honeywell underscores our commitment to pioneering innovative solutions that will propel the expansion of the connected intelligent edge,” said Nakul Duggal, group general manager, of automotive, industrial and embedded IoT, and cloud computing, Qualcomm Technologies, Inc. “Honeywell’s new Multi-Modal Intelligent Agent represents a significant step forward in utilizing advanced edge AI to streamline operations and elevate customer interactions across industries. This initiative enables us to drive digital transformation, enhancing how businesses interact with their environments through intelligent and responsive technology.”
“By pairing Honeywell’s easy-to-use mobile devices and intelligent software with Qualcomm Technologies’ industry-leading edge AI processors, Honeywell is creating solutions to make workers’ jobs easier while also helping businesses produce the stellar experience they want for their customers,” said Jason Urso, Honeywell Industrial Automation chief technology officer. “With AI, Honeywell is amplifying what’s possible for businesses with mobile workers today.”
The Multi-Modal Intelligent Agent is expected to be available in early 2025. To learn more about how Honeywell is leveraging AI across key industries, visit: https://automation.honeywell.com/us/en/solutions/productivity.
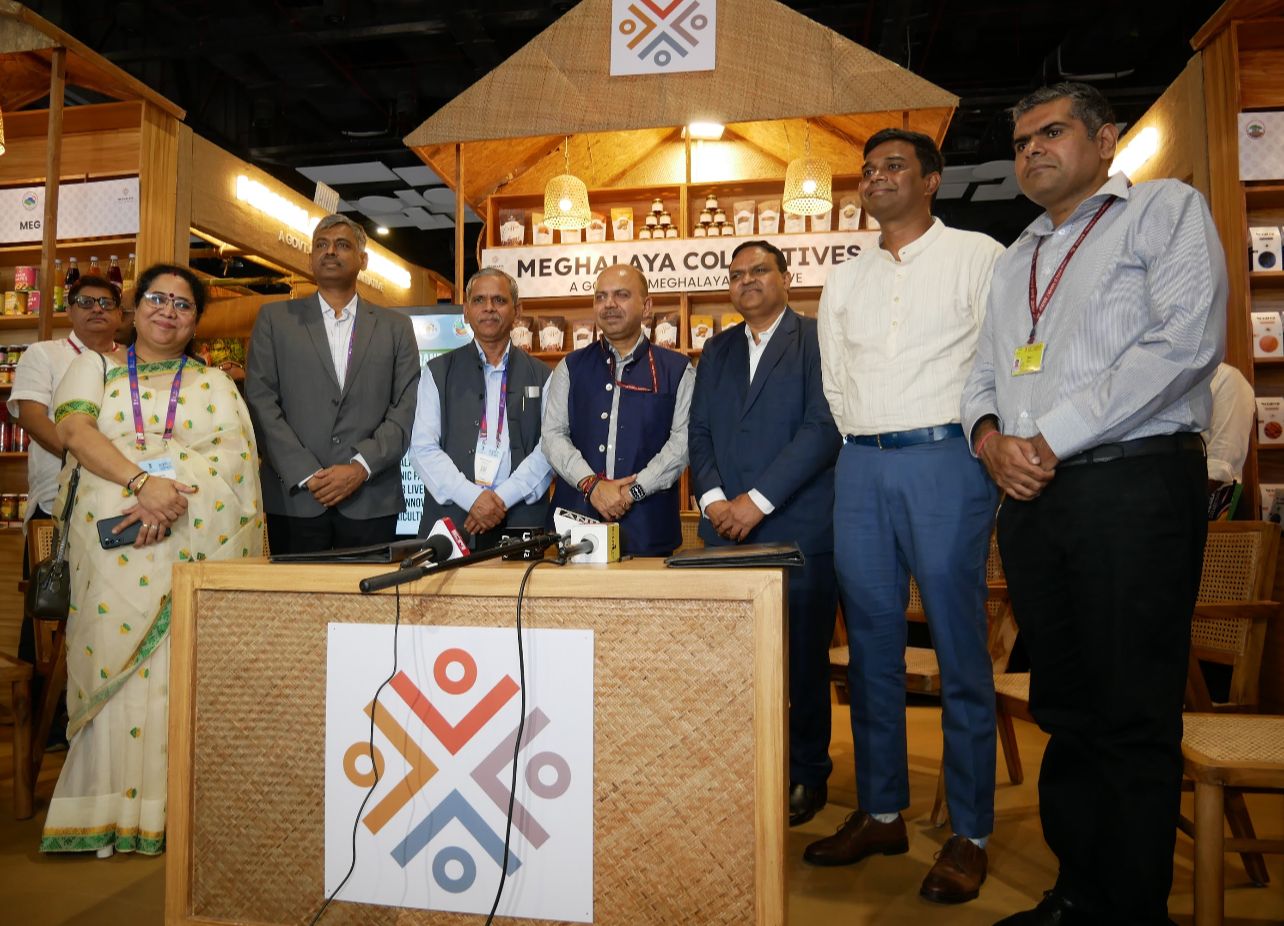
Meghalaya’s organic farming initiatives taking pace
Meghalaya, renowned for its verdant landscapes and rich biodiversity, is emerging as a key hub for organic farming in India. The state has embarked on various initiatives aimed at transforming agricultural practices and promoting sustainable livelihoods for its farmers. The state has been diligently implementing various schemes initiated by both the Central and State Governments to encourage the conversion of agricultural land into certified organic holdings. Notable among these initiatives is the Meghalaya Organic Value Chain Development for Northeastern Region (MOVCDNER) scheme, the State Organic Mission which has the ambitious objective of converting and sustaining 1 lakh hectares of land into certified organic. At present, 24,000 hectares of land have achieved organic certification, while an additional 8,000 hectares are in the conversion phase.
To further support and consolidate these efforts, the Cabinet approved the Meghalaya State Organic and Natural Farming policy on 11th January 2023. The policy outlines key objectives, including promoting organic farming as a sustainable income-generating activity for farmers, facilitating capacity building, investment, and technology development, and increasing farmers’ income through training, value addition, and market linkage.
To drive the effective implementation of this policy, the Meghalaya Natural and Organic Society for Livelihood and Innovation in Agriculture (MEGNOLIA) was established on June 1, 2023. Registered under the Societies Registration Act, MEGNOLIA functions as the apex body under the Department of Agriculture and Farmers’ Welfare Government of Meghalaya responsible for overseeing, coordinating, and executing the Organic and Natural Farming Policy in Meghalaya. MEGNOLIA’s primary goals include managing the implementation of the policy, supporting Farmer Producer Organizations (FPOs) and Farmer Producer Companies (FPCs) to professionalize organic production and marketing, promoting agro-industrial growth rooted in ecological sustainability, facilitating technology transfer, and fostering knowledge sharing among stakeholders.
Certification plays a critical role in organic farming. In Meghalaya, certification bodies ensure that farming practices adhere to the rigorous standards set by national and international organizations. Meghalaya now has its own APEDA-certified organic certification agency, the Meghalaya State Organic Certification Body, under the Planning Department. This makes it only the second such agency in the Northeast, following the Sikkim State Organic Certification Agency. With this development, the organic certification process for our farmers becomes more streamlined, as they no longer need to rely on agencies primarily based in Western and Southern India.
A major milestone in advancing Meghalaya’s organic farming sector was the signing of a Memorandum of Understanding (MOU) between MEGNOLIA and the National Cooperatives of Organic Limited (NCOL) on September 20, 2024 in the World Food India 2024. This partnership seeks to improve the procurement, marketing, and sale of organic products from Meghalaya. As part of the MOU, MEGNOLIA will link certified organic farmers with NCOL, help them obtain procurement approvals, and cover the costs of organic certification. In turn, NCOL will purchase organic products from these farmers, manage logistics, and ensure direct compensation to both farmers and service providers. This collaboration marks a significant step toward establishing a sustainable and profitable organic farming model in Meghalaya, improving farmer livelihoods while fostering environmental stewardship.
The government’s initiatives, embodied in the organic farming policy and led by MEGNOLIA, signal a bright future for organic agriculture in Meghalaya. Strategic partnerships, such as the one with NCOL, position the state to meet the growing demand for organic produce and champion sustainable farming practices that benefit both farmers and the environment.
How Sustainable Technologies Are Transforming Commercial Office Elements and Building Practices
Mr Sunil Bedi, Founder, JMD Group
The drive towards sustainability has become a defining characteristic of modern architecture and commercial building practices. As environmental concerns take center stage, businesses and developers are increasingly adopting sustainable technologies that not only reduce their carbon footprint but also enhance efficiency and long-term cost savings. This transformation is reshaping the way commercial spaces are designed, constructed, and maintained.
The Rise of Sustainable Building Practices
Sustainable building practices involve the integration of eco-friendly technologies and materials into the construction and operation of commercial buildings. These practices are guided by principles such as energy efficiency, resource conservation, and minimal environmental impact. The result is a new generation of office buildings that are not only environmentally responsible but also healthier and more productive for occupants.
Key Sustainable Technologies in Commercial Spaces
-
Energy-Efficient Lighting and HVAC Systems: One of the most significant areas of transformation is in lighting and heating, ventilation, and air conditioning (HVAC) systems. Modern commercial buildings are increasingly incorporating LED lighting, which consumes significantly less energy and has a longer lifespan compared to traditional lighting. In addition, smart HVAC systems use sensors and automation to optimize temperature and airflow, reducing energy consumption and enhancing comfort.
-
Green Building Materials: The choice of materials plays a critical role in sustainable construction. Materials like reclaimed wood, recycled metal, and low-VOC (volatile organic compound) paints are becoming standard in green building projects. These materials not only reduce the environmental impact but also contribute to better indoor air quality and occupant health.
-
Water Conservation Technologies: Water efficiency is another crucial aspect of sustainable office buildings. Technologies such as low-flow fixtures, water recycling systems, and rainwater harvesting are helping commercial spaces reduce their water consumption. These innovations are essential in areas where water scarcity is a growing concern and contribute to the overall sustainability of the building.
-
Renewable Energy Integration: The integration of renewable energy sources, such as solar panels and wind turbines, is becoming increasingly common in commercial buildings. These technologies enable offices to generate their own clean energy, reducing dependence on fossil fuels and lowering greenhouse gas emissions. In some cases, buildings can even produce surplus energy that can be fed back into the grid.
-
Smart Building Management Systems: The rise of the Internet of Things (IoT) has given birth to smart building management systems that allow for real-time monitoring and control of energy usage, lighting, security, and more. These systems provide valuable data that can be used to optimize building operations, reduce waste, and improve overall efficiency.
The Impact on Office Design and Employee Well-Being
Sustainable technologies are not just about reducing environmental impact—they also enhance the quality of the work environment. Natural light, improved air quality, and comfortable temperatures contribute to a healthier and more productive workspace. Studies have shown that employees in green buildings report higher levels of satisfaction, well-being, and productivity, leading to better overall business performance.
Furthermore, the adoption of sustainable technologies aligns with the growing demand for corporate social responsibility. Companies that prioritize sustainability can enhance their brand image, attract top talent, and meet the expectations of environmentally conscious clients and investors.
Conclusion
The integration of sustainable technologies into commercial office elements and building practices is no longer a trend—it’s a necessity. As businesses and developers recognize the long-term benefits of sustainability, we can expect to see even greater innovations in this field. From energy efficiency to smart building management, these technologies are transforming the commercial real estate landscape, paving the way for a more sustainable and prosperous future. The commitment to sustainability is not just about protecting the environment; it’s about creating spaces that foster well-being, efficiency, and success.
 news
news
2024 Study: States Where Building a Home Beats Buying
| State | House Sale Price | Land price (per acre) | Architectural and Design Fees | Construction Costs | Utilities Hookup | FInal Score |
| Hawaii | $856,327 | 24,170 | 25000 | 450 | $600 | 50.0 |
| California | $782,695 | 15,445 | 35000 | 300 | $625 | 44.2 |
| Massachusetts | $609,415 | 48,830 | 22000 | 275 | $625 | 37.3 |
| Washington | $588,986 | 21467 | 19000 | 200 | $360 | 31.8 |
| New Jersey | $508,430 | 17,739 | 19000 | 240 | $575 | 31.4 |
| New York | $458,072 | 5187 | 35000 | 275 | $625 | 30.5 |
| Colorado | $548,602 | 23,781 | 16000 | 200 | $360 | 30.2 |
| Rhode Island | $449,550 | 29621 | 13500 | 215 | $575 | 28.8 |
| New Hampshire | $463,091 | 17,259 | 12000 | 200 | $575 | 28.7 |
| Utah | $518,241 | 17542 | 12000 | 155 | $360 | 27.9 |
Ganga Realty’s ‘Anantam’, Gurugram’s Tallest Residential Tower, Receives Overwhelming Response During EOI Phase
Ganga Realty, a prominent real estate developer based in Gurugram, has recently unveiled ‘Anantam’, the tallest residential tower in the city, located in Sector 85. The project’s Tower A, launched under an exclusive Expression of Interest (EOI) phase, received an extraordinary response from homebuyers in a remarkably short period. Ganga Realty is offering a limited-time Expression of Interest (EOI) with a special inaugural rate. The first 50 buyers can secure units at Rs 16,500 per sq ft, providing significant savings compared to the introductory price of Rs 17,500 per sq ft. With an EOI deposit of ₹10 lakhs, buyers can enjoy benefits worth over ₹25 lakhs. This exclusive opportunity is available for a short period and will be ending on October 11th. Additionally, the company is extending further benefits by waiving the first transfer fee, provided buyers complete 30% of the total payment booking.

On September 16th, Ganga Realty held a Bhumi Pujan at the Anantam site to seek divine blessings and helm the project on an auspicious note.
Apart from encompassing the tallest residential towers in the development landscape of Gurugram and Delhi, boasting G+59 floors, Anantam is also overloaded with voguish amenities such as a 1 lakh sq ft state-of-the-art Clubhouse, along with separate Indoor & Outdoor Sports Clubs, a Business Centre, a Dynamic Socio Club, a Museum, a Jewellery Cafe Lobby, and a Knowledge Park.
Talking about the EOI phase for Anantam’s Tower A, Vikas Garg, Joint Managing Director, Ganga Realty, commented, “We are delighted to conclude the opening of the EOI Phase for Tower A of our uber-luxury offering, Anantam. We would like to thank all the homebuyers who showed a vociferous interest in our project. Our project is an amalgamation of our founding philosophy and high-tech technologies to provide skyline living to our customers. We are happy to have received rave reviews about our newly launched project and are equally pleased that our buyers resonated with the concept of Dubai-based living experience we are aiming to recreate with this outing.”
Anantam’s Clubhouse will feature endless recreational amenities such as 4 Infinity Pools, a Gymnasium, a Yoga Room, an Observatory Deck, a Wave Pool, a Sun Lounger, an Open Air Bar, and a Restaurant with a Cafe. Alongside that, the Indoor Sports Club will feature elaborate spaces for new-age sports and fitness regimes such as Table Tennis, Billiards, Squash, Pilates, and a Meditation Room. The Outdoor Sports Club will entail a Cricket Pitch, a Badminton Court, a Jogging Track, a Basketball Court, a Skating Rink, a Kids’ Play Area, a Yoga Deck, a Meditation Area, a Reflexology Area, a Panchtatva Park, a Pet Park, an Open Gym, and a Climbing Wall.